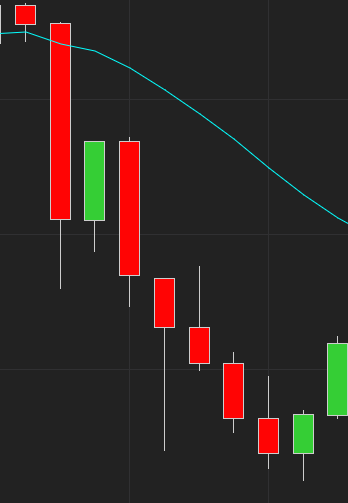
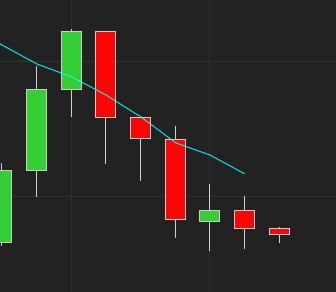
Everyone is likely familiar with the simple moving average (SMA). In trading, it is a lagging indicator used to visualize the average trend of price action over windows of time. Below is a chart with the SMA(14) plotted on it. Each data point corresponds with the average closing price of the 14 closing prices preceding it.

As you can see, the SMA(14) follows the general trend of the chart, but one thing is clear: it’s always lagging behind the actual price movement:


Visually, it appears that the SMA is shifted right of the price bars. In essence, they are, because the SMA lags. Also, since the SMA is an average of the previous prices, the curve is smoother and seems to travel somewhere close to the middle of the price action. Averages being averages, however, this will not always be the case.
So what can we do?
If moving averages are lagging, is there any way we can use them to predict the next value? Actually, there is.
Going back to geometry class, one might remember computing the slope of a line: y = dy / dx. The concept is simple enough: compute the difference in price from the T-1 time to the T-Tx time. In our case, since we are assuming 14 time periods, then it would be T-14 time periods. The difference in time would then be 13, because there are only 13 time periods separating time period T-1 to time period T-14.
Analysis
Given the above formula, let’s look at something we shall call the “SMA Projection”, because it can be used to project or predict the next value in the series based on the calculation of average price changes over time.

The color scheme above is a little different than earlier. This time, the goldenrod color is the SMA(14), and the aqua color is our SMA(14) projection.
Following the SMA(14) with the projection, we can consider a couple questions:
- How far away from our projections were we compared to the SMA that was ultimately calculated? The closer we are, the less volatility there is, and the more accurately we have predicted where the average is moving.
- How far away from our projections were we compared to the actual closing price? Again, the closer we are, the less volatility there is, and the more accurately we have predicted where price action is moving.
Can we trade based on this?
Looking closely at the above charts, it is possible to surmise some patterns that could lead to profitable trades:
- If the open is below the prediction but the slope of the prediction is increasing, we could assume that price action is beginning to move upward in the direction of the averages, and we should enter long.
- Conversely, if the open is above the prediction but the slope of the prediction is decreasing, we could assume that price action is beginning to move downward in the direction of the averages, and we should enter short.
Looking at the charts, we can see several possible opportunities like this. We can also see that there are several false positives as well.
Do we use this?
Personally, I would not use this as a very effective predictive measure on its own. Combined with Bollinger bands, it may be more effective, but it is still based on lagging data. The lag can be improved by shortening the time period of the SMA, but then it becomes more like looking at current price action rather than trends. If you want to play with that, however, you can try several, maybe starting with a period length of 5 rather than 14.
Conclusion
The point of this article was to serve as an easy-to-understand introduction to predictive analytics. Most people understand moving averages, and the simple moving average is the easiest of them all to grasp.
So what exactly is happening, and how can we leverage it? Well, predictive analytics basically involves determining the slope of a “line” or some other higher-dimensional surface and then predicting the next value on that surface by following the slope. Even when reaching the level of neural networks, although the math becomes more complicated, a slope is ultimately determined, and we use it to compute which category our next predicted data point is at time T. Although, in the case of neural networks, the opposite question can be asked: given actual input appearing right now, what category is it?
What’s next?
In our next article, we will continue to explore the SMA Projection in code. This will allow readers to become familiar with coding and the basic math involved before we begin moving to more advanced models.

Leave a Reply